All Images
Introduction
Monitoring a Job's Performance
Figure 1
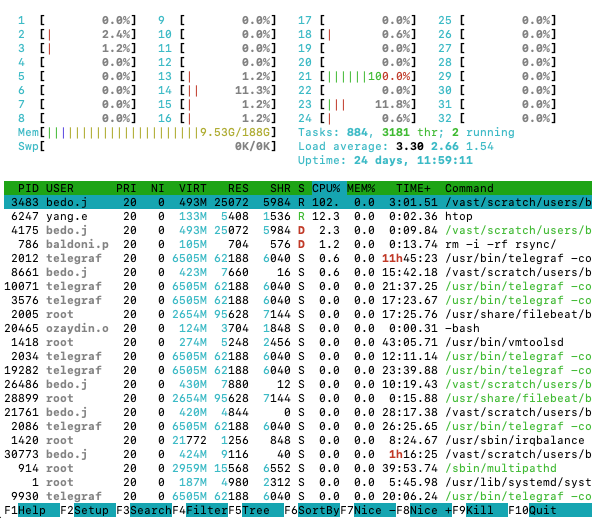
Screenshot of
htop outputFigure 2
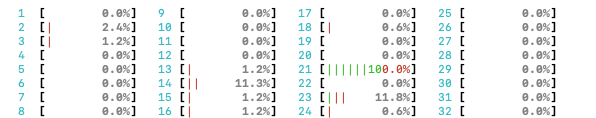
CPU utilization bars from
htop
Figure 3

Memory utilization bars and load from
htop
Figure 4
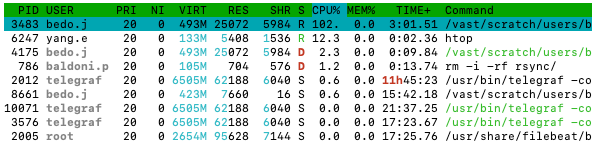
Process list and fields from
htop
Figure 5
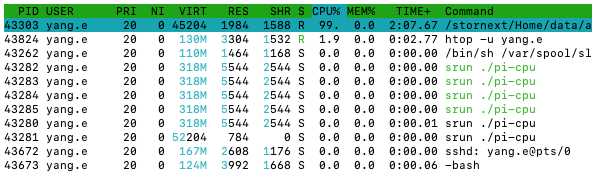
processes associated with
pi-cpu
Figure 6
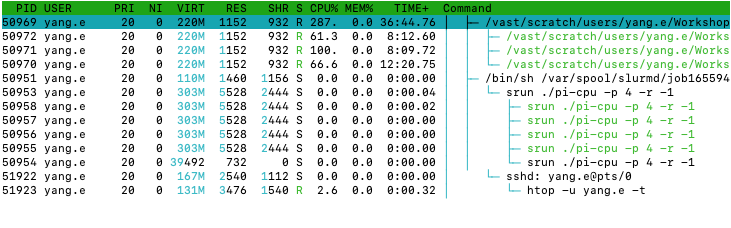
processes associated with
pi-cpu
after requesting more CPUs from SlurmFigure 7
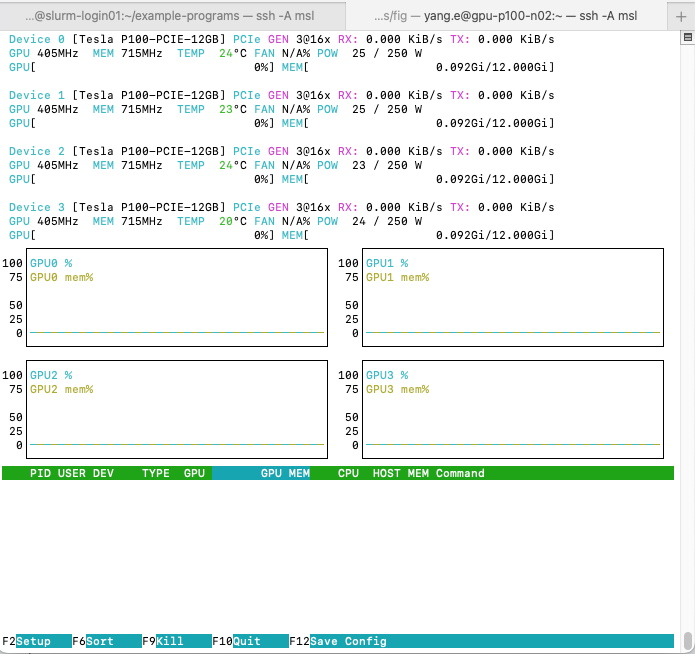 Your output may differ if other
people’s jobs are running on the same node. The interface will be
reminiscent of
Your output may differ if other
people’s jobs are running on the same node. The interface will be
reminiscent of htop but with differences:
Figure 8
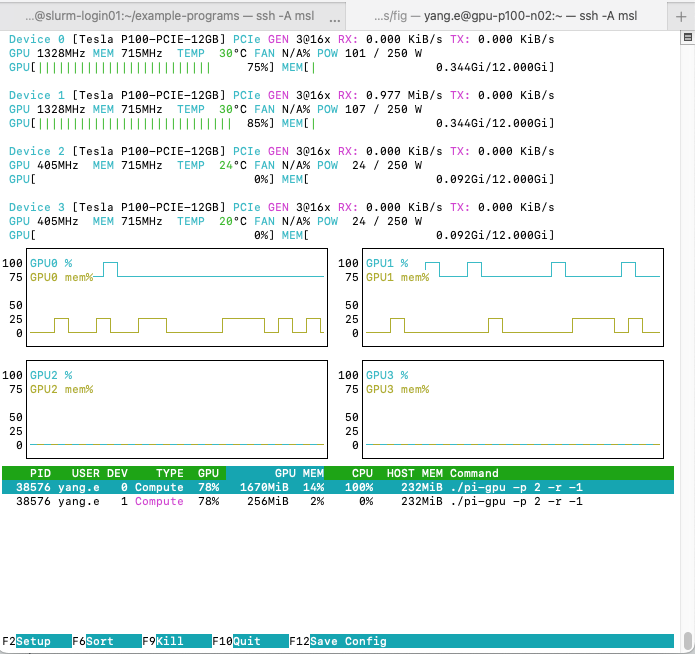
nvtop interface with
pi-gpu -p 2 -r -1 runningJob Arrays
Figure 1

Job arrays submit multiple copies of the same
script, each with the same job ID, but unique “task IDs”, which can be
used to control each task’s behaviour.